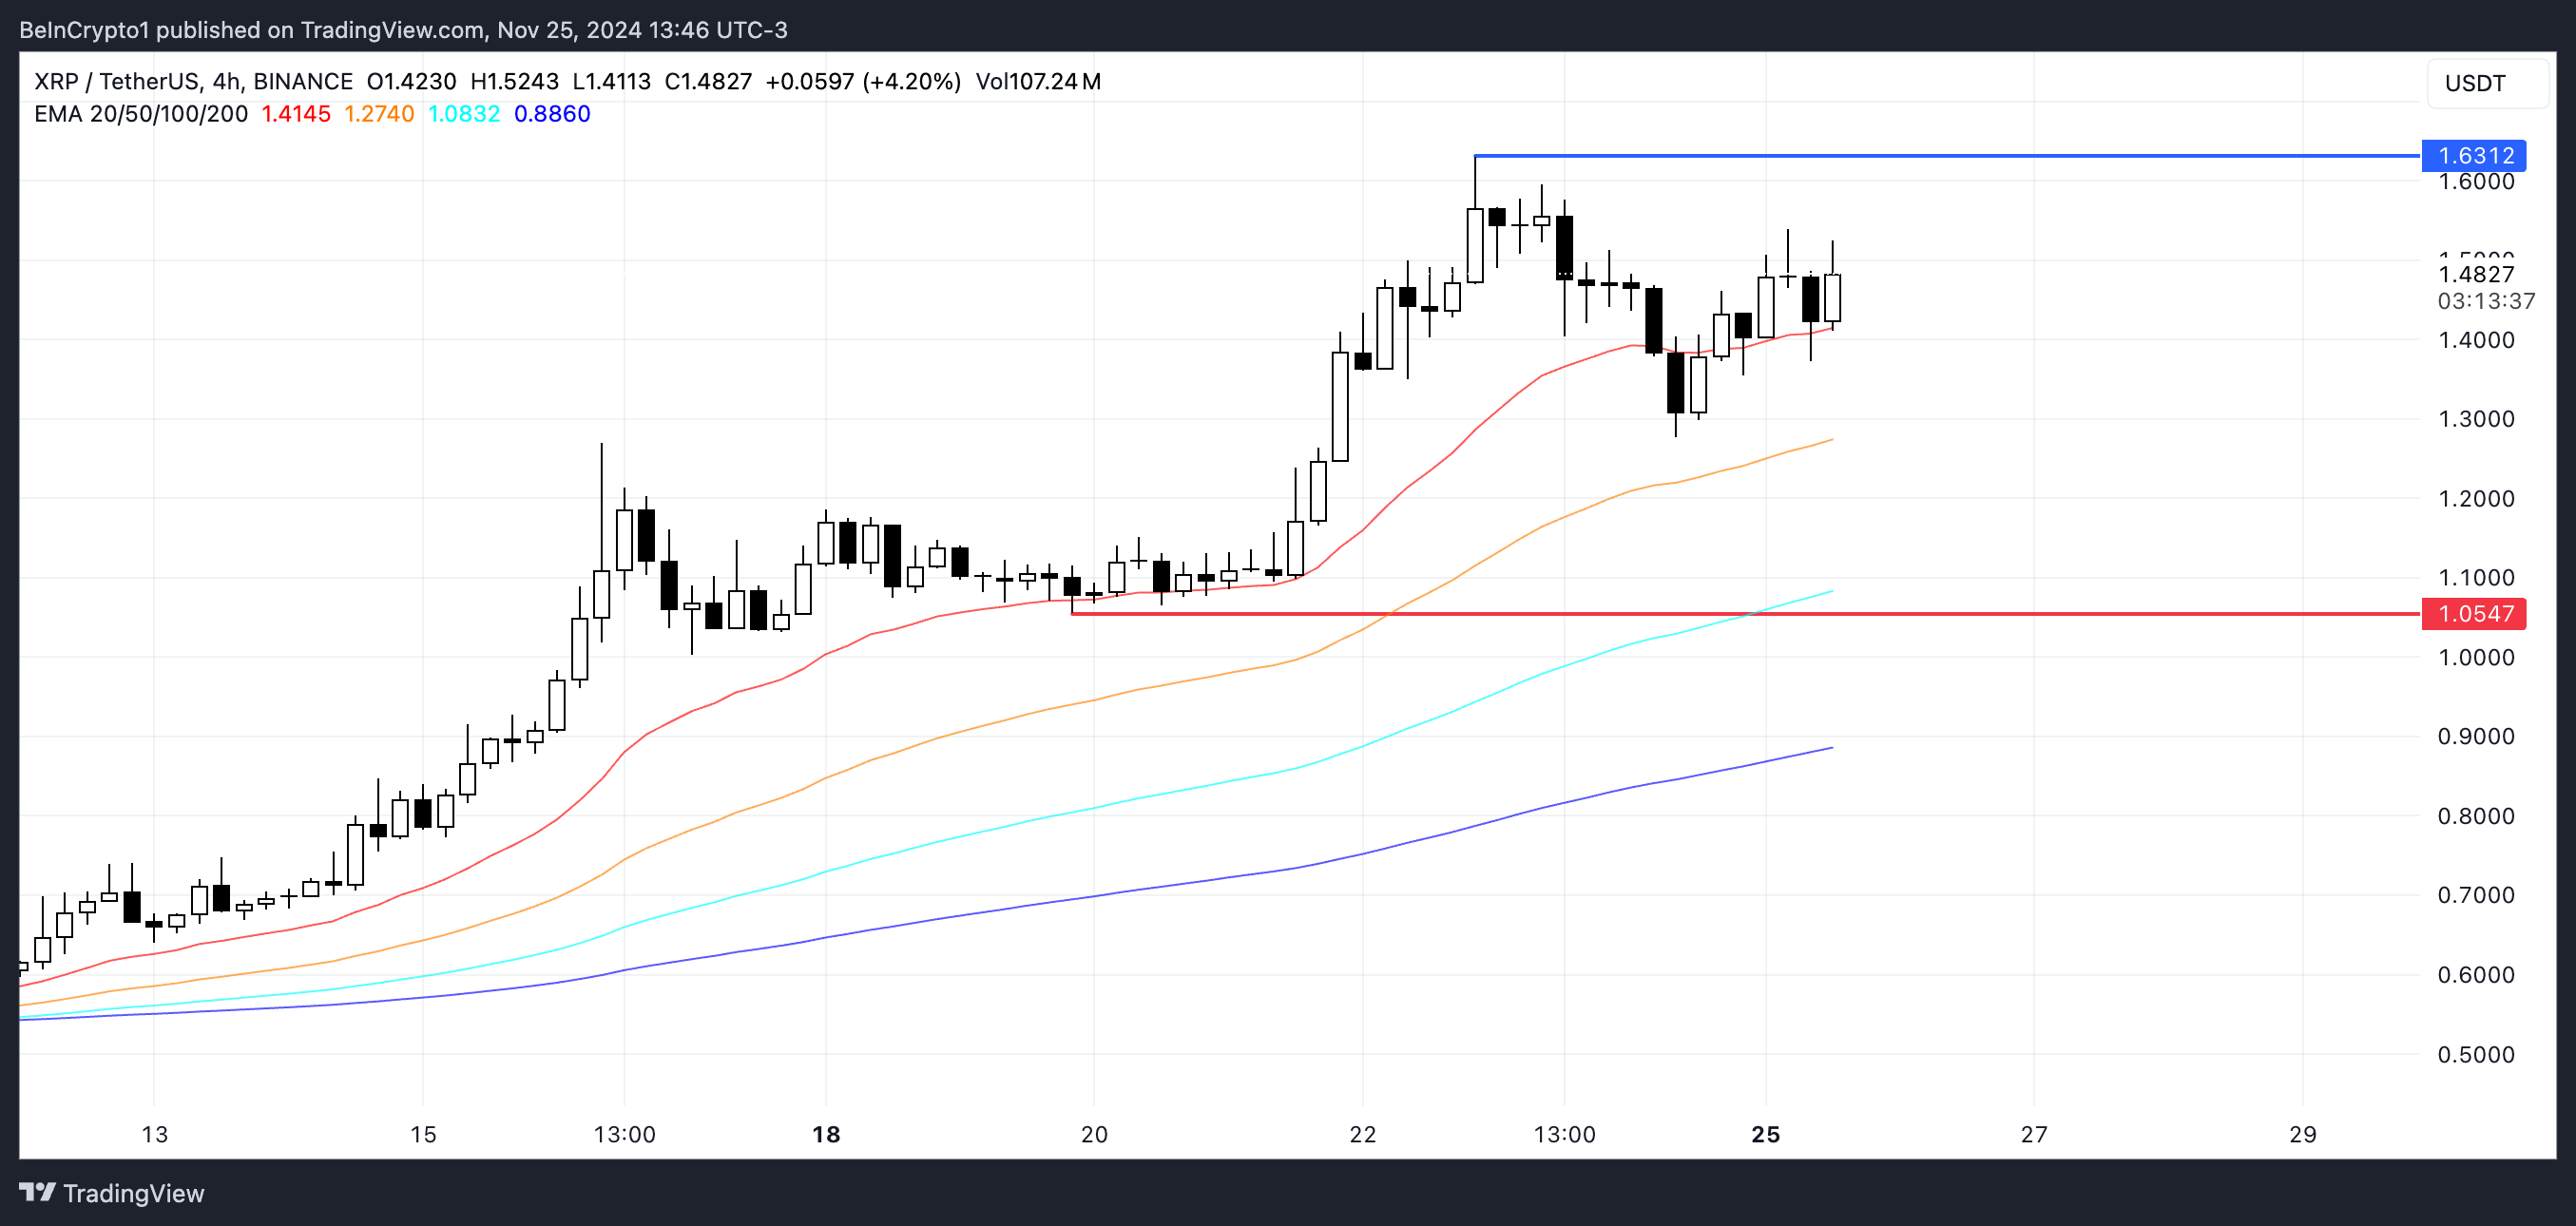
Ripple (XRP) price has surged 182.80% in the last 30 days and 30.26% in the past week. While its EMA lines remain bullish, with short-term lines above long-term ones, indicators like RSI and CMF suggest the uptrend could be losing steam.
A weakening momentum might lead XRP to test support at $1.05, with the risk of falling below $1 if selling pressure grows. However, if buyers regain control, XRP could target resistance at $1.63 and potentially reach $1.7, its highest price since 2018.
XRP RSI Is In A Neutral Zone
Ripple RSI is currently at 58, a decline from over 70 just a few days ago. The RSI, or Relative Strength Index, measures the momentum of price movements on a scale from 0 to 100, with values above 70 indicating overbought conditions and potential for a pullback, while values below 30 suggest oversold conditions and possible price recovery.
The drop from 70 to 58 reflects cooling bullish momentum, signaling that the recent rally may be slowing down without yet entering bearish territory.
An RSI at 58 suggests XRP remains in a healthy range, leaning toward bullish sentiment but with reduced buying pressure compared to earlier levels. Following a 30.26% price surge in the last seven days, the RSI decline indicates a period of consolidation may be ahead.
If RSI continues to fall, it could hint at increased selling pressure, potentially leading to a price correction. However, if the RSI stabilizes or rises, XRP price could regain momentum and attempt further upside.
Ripple CMF Is Heavily Declining
XRP’s CMF is currently at 0.02, a decline from 0.11 just two days ago, indicating a significant reduction in buying pressure. The CMF, or Chaikin Money Flow, measures the flow of capital into or out of an asset over a period, with values above 0 indicating net inflows (buying pressure) and values below 0 reflecting net outflows (selling pressure).
Since November 22, Ripple CMF has remained positive, signaling that buyers have consistently maintained dominance despite the recent decline.

With a CMF at 0.02, Ripple still reflects a slight net inflow of capital, suggesting the bullish sentiment has not entirely faded but is weakening. If CMF turns negative, it would indicate a shift to net outflows, potentially signaling increased selling pressure and a possible price correction.
For now, the positive CMF supports a cautiously optimistic outlook, but further declines could signal the beginning of a bearish trend for XRP price momentum.
Ripple Price Prediction: Is $1.7 On The Horizon?
XRP’s EMA lines maintain a bullish setup, with short-term lines positioned above long-term ones, indicating that the overall trend remains upward. However, other indicators like the CMF and RSI suggest that the uptrend may be losing momentum.

If the bullish trend weakens further and a downtrend emerges, XRP price could test key support around $1.05, with the potential to fall below $1 if selling pressure intensifies.
On the other hand, if the uptrend regains strength, XRP price could break through its resistance at $1.63 and aim for $1.7, which would mark its highest price since 2018.
Disclaimer
In line with the Trust Project guidelines, this price analysis article is for informational purposes only and should not be considered financial or investment advice. BeInCrypto is committed to accurate, unbiased reporting, but market conditions are subject to change without notice. Always conduct your own research and consult with a professional before making any financial decisions. Please note that our Terms and Conditions, Privacy Policy, and Disclaimers have been updated.


